Knee pain Running Downhill: ITB Exercises

ITB Syndrome is worse on the downhill (1)

When running downhill becomes a pain in the ITB

To a runner suffering from ITB Syndrome, nothing says “hello knee pain” more than a good stretch of downhill terrain. For the uninitiated, ITB stands for Iliotibial Band. Whilst ITB Syndrome is an overuse injury, it can strike anyone, anytime, without warning. It is more often found in runners than in the rest of the population, but it’s not the exclusive domain of runners.

What is an ITB?

Your iliotibial band is a band of fascia which starts off near the outside of your hip. It then runs down the side of your leg and attaches into the kneecap and the two shin bones. The purpose of the ITB is to stabilise both your pelvis and your knee.

How does the ITB cause pain?

ITB pain can  sometimes be felt in the hip, where it’s thought the ITB causes friction over the bursa that sits between your hip joint and the ITB. The bursa is a little sac of fluid that adds cushioning to the joint. Bursae can be found in joints all over the body. 
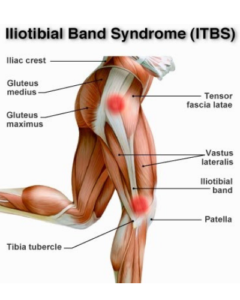
It is far more common for the ITB to cause pain on the outside of your knee. What is actually happening to cause the pain is still up for debate.

For quite a while, it was thought that the pain was caused by the ITB rubbing backwards and forwards on the bone underneath it. The condition was known as ITBFS – Iliotibial Band Friction Syndrome.

Then new research showed that actually, the ITB is attached to the bottom of the thigh bone -meaning there couldn’t be any forward and backwards movement, leading to the conclusion that ITBFS, was in fact just ITBS – (that is, the F for FRICTION is taken out of the acronym, as no friction is created if the ITB is not moving). It was then posited that the pain in ITB Syndrome is caused by compression of fat structures, inflammation of bursae, or possibly due to structural changes in the ITB. 

Fast forward a few years, and new research has shown that in fact the ITB does move, so could it be that the pain is caused by friction after all?

Pretty much, no-one’s quite sure exactly what is going on down there.

Read enough? Jump down to some strength training videos

Why does your knee hurt more when you run downhill if you have ITB Syndrome?

Ankle Stiffness

When you’re running on any type of terrain, the shin moves forward and downwards towards the foot and it should also rotate and twist inwards a small amount. So you need good mobility (enough but not too much) in your ankle joint. If your ankle is a little stiff and can’t move properly in these different directions, excess forces are likely to move up to the knee. The knee might be forced to bend or rotate more than it should, resulting in the tissues around the knee having to bear more load than they should. When you’re running downhill, this is exacerbated.  Your foot hits the ground and stops, but the rest of your body continues in not only a forward motion, but also a downward motion, requiring greater ankle flexion.

Knee Flexion at 30 degrees

The ITB rubs against the bony bit at the side of your knee (the lateral epicondyle) just after your foot hits the ground. This rubbing happens when your knee is at or slightly less than 30 degrees of knee flexion. With downhill running, your knee is a bit straighter when your foot hits the ground than it is when you’re running on other terrain. Your foot also hits the ground with greater impact than in level or uphill running. You’ll find your ITB is far less likely to be painful if  you’re running up hill, as your knee stays more bent whilst your foot is on the ground.

At least at first. If you bury your head in the sand and don’t seek treatment, you’re likely to end up with pain 24/7.

Risk factors and causes of  ITB Syndrome

Weak Hip Abductors?

No-one really knows for sure what causes the ITB to give you pain. Some research shows ITB pain goes hand in hand with weak hip abductor muscles (they’re the muscles that take your leg out to the side and help to stabilise your pelvis). Whether the weak abductors are actually the cause of the ITB pain or the result of the ITB probem is uncertain.

One often cited study showed that of the 24 runners in their study with ITB issues all showed hip abductor weakness in their bad leg. The group then did 6 weeks  6 weeks of strengthening of their hip abductors and at the end of that six weeks 22 of them were pain free and could return to running. 

But here’s the thing – they also took anti inflammatory drugs, undertook massage and stretching to loosen off and normalise the tissue in their legs, and stopped running. The researchers really had no idea whether the strength training “cured” the ITB issues. Nor did they know if the weakness in the subjects’ abductor muscles was the cause of the ITB pain, or in fact the ITB problems caused the weakness in their abductor muscles. 

Other risk factors

  • runners with ITBS versus a non injured control group were less experienced, were doing greater weekly mileage, and had a greater percentage of their training on the track
  • Weakness in knee flexion and knee extension (bending and straightening of the knee) in people with ITB issues
  • Training on cambered roads might cause ITB problems
  • Bow legs
  • Thickened IT bands
  • Muscle imbalance or weakness in the gluteus medius leading to early firing, overactivation, and tightness of the tensor fascia lata and iliotibial band

Prevention

1: Avoid over training

The one thing that is certain is that ITB Syndrome is caused by overuse. So to prevent it, you need to be sure you are not doing more running than your body can handle.  To avoid over training, you need to be careful not to increase your training load too quickly.

  • Build recovery into your training plan
  • Include recovery sessions, rest days, and recovery weeks
  • Don’t add massive amounts of mileage from week to week
  • Avoid increasing mileage and intensity at the same time
  • Add variety to your program
  • Train on different types of terrains and surfaces
  • Get enough sleep

2: Get Strong

There isn’t any definitive research that shows that strength training will prevent ITB issues, but that doesn’t mean it won’t help. It makes sense to include a good all over strengthening regime in your training. It is likely it will help in injury prevention, and it’ll also make you run faster, so why not do it? Strength training for running will never be a waste of time.

Treatment

  • Get onto the problem straight away. Don’t think it will go away on its own, as it is most unlikely to
  • Eliminate the pain – this may be by ice, anti-inflammatories and/or ceasing activities which cause pain (in our case, running).
  • Massage and/or use a foam roller on the outside of the leg to normalise the soft tissue, which is likely to be tight and help the hip abductors. Do not massage directly over the focal point of the pain. 
  • Undergo a strength training protocol which strengthens the hip abductor muscles
  • Improve flexibility in your ankles through calf stretching and regularly rotating your foot through it’s full range of movement

NOTE: anti inflammatory drugs should only be taking to help reduce the inflammation, which will then make the injury easier to treat. You should not take anti inflammatories to mask the pain so that you can continue running on an injury!

If you do not see significant improvement in symptoms after a few days of self management (and this means coming off any pain killers so that you’ll know if there is an improvement) you should definitely seek advice from a physiotherapist.

Strength training exercises for ITB Syndrome prevention and treatment

Hip Hitch

Clam and Side Leg Raise

Case Study- My ITB Experience

In my own experience, massage was VERY effective in getting rid of my ITB problems. However, I got onto the issue straight away, AND it was not caused by running. I was hardly doing any running at the times – (so much so that when I told my husband I thought I had ITB problems he laughed right in my face). My ITB issues were caused by sitting at my desk too long with my legs crossed. I was sitting down one day, stood up and bang, pain in the knee. Not crippling, but bad enough for me not to want to walk too much. And sure enough, it was worse for going down stairs and down hills. I made a quick trip to my physio to confirm my diagnosis and check there were no structural issues. She massaged me to within an inch of my life, and I continued for a few days with self massage. Didn’t even have to jump on a foam roller. I did stop crossing my legs, and I didn’t run till the pain was gone.

Make Sense of Your City to Surf Results

City to Surf Results

Each year I receive lots of text messages and emails after our runners have finished the City to Surf. And each year, these messages convey a mixture of elation and disappointment. This year of course was no different.

As coaches, we probably view your results differently to the way you view them. I thought I’d share a few of the things you should be looking at when you’re analysing this year’s results.

Your Start Group

The City to Surf is like no other race. It’s tough, it’s hilly and there are lots and lots of people. If you’re a front runner, the crowd factor isn’t going to impact you too much. If you’re running with the back of the pack, you’re unlikely to be able to get much of a rhythm going. You also have  the disadvantage of coming through the water stations after 50,000 people have slurped, spilt and thrown their paper cups on the ground.  You need to slow down a bit through the water stations, just for safety’s sake.

The Weather

Even though the City to Surf is a winter run, it can get pretty hot. Yesterday it was 14 degrees at 8:30am, and 16 degrees at 9:30. Last year the temperature was 9 degrees at 9am, and the top of 16 degrees wasn’t reached until 3pm that day. If you’re comparing this year’s run to last year’s,  you need to take that temperature difference into account. Research done on some of the big city marathons has shown that performance decreases with a rise in temperture.

For the top three placegettes, the decrease in performance was a bit less than 1%, for every 5 degree rise in temperature above 10 degrees C. For slower runners, this drop in performance increased exponentially. Unforutnately, the reasearch only looked at the first 300 runners. The 50th placed runners’ performance dropped by 1.5%, the 100th placegetters by 1.8%, and the 300th place getters by 3.2%. 300th place would be a time of around three hours for the marathons in the sample. 

If you’re comparing your time from this year’s City to Surf to last year, unless you’re a three hour marathoner, you should expect that your performance would have dropped by more than 3.2% due to the difference in temperature. To put that into perspective, a 3.2% drop in performance on a 70 minute run last year, is equal to about a 72:15 this year.

They Have Age Categories for a Reason

If you were at maximum fitness level in your prime, as you get older, your performance will naturally decline. If you weren’t at peak fitness in your younger years, you’re more likely to be able to maintain your performance simply be increasing your level of fitness. 

Age graded performance tables are a great way to evaluate your performance against previous performances, and also across different events. Your age graded percentage show you how you compare to the world’s best of your age and gender. Our coach Richard Sarkies, who has a City to Surf best time of 48:12, set 12 years ago, ran 52:12 yesterday. Comparing these two runs on the age graded tables actually shows he went slightly better this year. 

You can use this calculator to compare your own age-graded times. 

Make sure you press “Age Grade” next to where you enter your time to get your result at the bottom.

Analysing This Year’s City to Surf Result

Once you’ve established that your time is actually pretty good compared to last year’s cooler weather time or your time of 20 years ago, you can start to learn from your results.

Firstly, you should check if your goal was realistic. When I asked Richard if he was happy with his result, he replied he “couldn’t have gone any faster”. I thought he’d been aiming for around 50 minutes, and when I asked him about that he said something like  “that would’ve been nice, but what you hope to get and what you’re able to achieve are two completely different things”. After having quite a long time off rehabbing an Achilles injury, he knew he probably didn’t have the endurance to get him through to the end.

My Race Goals

Not being a massive fan of crowds, or spending hours getting home when I’m sweaty and cold, I’d never done the City to Surf before, so I didn’t really know what to expect. For various reasons, my training over the last 2 years has been intermittent at best, and I knew I didnt’ have the sort of base that’s required to do the race any justice. On top of that, I developed a nasty sinus infection about three weeks out and was laid out, unable to train. So I had a few things to take into account when setting my goals for the race.

My goals were:

  • To run on feel rather than use any kind of GPS device. (I did use my stop watch to roughly keep track of how I was going at each km marker).
  • Run conservatively for the first half of the race, and run the second half of the race after heart break hill faster than the first half
  • Be prepared to walk some of the race if I felt I needed to
  • As far as time went, I really thought I’d be lucky to run under 90 minutes (my pre-sinusitis goal had been under 80-mostly likely too ambitous)

Goal number one was pretty easy, as I don’t have a GPS device at the moment

Goal number three – I was definitely prepared to walk –in fact I did walk through a couple of the drinks stations to make sure I rehyderated (confession – I had a couple of champagnes the night before-why not since I was treating it as a training run, right?)

Goal number three-the numbers aren’t pretty, but my results do show I ran a fairly even race.

My City to Surf Splits - not pretty

Looking at the split rank (S/Rank) and the race rank (R/Rank) you can see that I moved through the field as the race progressed. Not so rapidly in the second half of the race. 

You can also see I ran 36 seconds faster over the back half of the course. I’m not entirely convinced the course measurements are accurate, but they wouldn’t be too far out.

Look at How You Handled Heart Break Hill

Everyone slows down up heart break hill. It’s a reasonably steep, long,  relentless 1.4km in the middle of the race, so you should expect to slow down a bit. But how do you assess whether you slowed more than you should?

Looking at my figures, you can see that I pick up nearly 2000 places going up the hill. This means that I ran faster up heart break hill than 7% of the people who were running faster than I was before heart break hill. 

These figures alone don’t tell you much, other than I was slower up the hill than 21,082 people. But, using those figures, along with how I felt throughout the race is useful. I felt ok going up the hill. I felt that before heartbreak hill I was running at a pace I’d be able to maintain for 90 minutes. The fact that I slowed down up the hill definitely helped me maintain my pace in the back end of the race. I was exhausted for the last 2 km of the race due to lack of fitness, but it wasn’t running up the hills too hard that did it to me.  I was conscious of my form going up the hill, shorter strides, quicker turnover to put less strain on my legs. I used the tangents to make sure I ran the shortest distance possible. All in all, I was happy with how I handled this part of the course. 

Another way you can guage how you went with heart break hill is by comparing yourself to some of the front runners.  The first few place getters slow down by about 8%, Richard (208th place) slowed down by 21%, and I slowed down 15%. I still think I have a lot of room for improvement on my up hill running, but comparing these figures, I think it shows I’m heading in the right direction.

What To Do With the Data

Use your City to Surf race stats to help you learn for next time. Good race or bad race, you can take note of the stats and how you were feeling on the day, and learn a lot. If you started out at 4:30 pace, and finished up at 5:30 pace, think about how you felt for your first few kms. Remember that feeling, and know that next time, that feeling is tricking you into running faster. You have to feel as if your effort is easier than that next time you race.

If you slowed down dramatically up heart break hill, was it because you’d gone too fast early in the race?  Was it because you deliberately slowed down to conserve energy?  Or was it because you’re not great at running up hills and you need to build some strength in your legs and work on your hill technique?

If your’e planning on improving next time you race, make some notes now on how you ran, how you felt, what you did leading into the race.  What did you do well, what would you do differently next time?  When you start to plan your training for your next race, you’ll know what you need to work on.

A Good Day Out

At the end of the day, whatever your result, it was a beautiful day out with nearly 70,000 other Sydney-sider, celebrating living in this awesome city of ours.

And it was a VERY good day out for Hooked on Runing teams. You can see our team results here. link to our results page

City to Surf 2016: Our results

Hooked on Running singlet

This year we had our biggest teams ever. Our 50+ women led the charge with 13 team members, and we had two men’s teams this year, open and 50+.

We had some great results, but I’m far more excited about the number of our runners who enjoyed racing under the Hooked on Running flag.

Hooked on Running City to Surf Results

Open Women: 4th

Open Men: 10th

Women 40-49: 2nd

Women 50+: 2nd

Men 50+: 3rd

The Teams

These are our official teams lists, but we had quite a few other runners running for charity or with a work team. Fantastic turnout people. Richard and I are over the moon. Details of celebration dinner to come!

Hooked on Running women 50+
Hooked on Running women 40-49
Hooked on Running Open Women
Hooked on Running Open Men
City to Surf Hooked on Running 50+

The City to Surf is More Than Heartbreak Hill

Why You Need to Train for The Downhill Sections Too

If you’re one of the 80,000 strong field who’ll be making their way from the city to the surf this year, you need to be getting good at downhill running.

Yes, that’s right folks. Being good at downhill running can make your City to Surf!!

Watch the video to find out why running downhill well is important for a good City to Surf experience, and an easy(er) time on heartbreak hill.

httpv://youtu.be/WpwRhcD9tYY

See how the simple squat  can be modified to get your legs ready for the hilly City to Surf course. Combine the squat with a simple hamstring exercise, and you’re well on the way to a better City to Surf experience.


City to Surf 2013

Congratulations to our Open Women’s Team on placing fifth in the 2013 City to Surf. 

Great to see a big contingent of “Hooked on Healthers” at the City to Surf this year, both as runners and also as volunteers manning the drinks stations with the scouts and other volunteer groups.


Our women’s open team placed 5th with an overall time of  3 hrs, 45 mins and 7 secs. This in spite of Jane Raftesath running in odd shoes. Somehow the last minute shoe lace change left her wearing one old shoe and one new shoe to the start line!


Tara McNamara (Sat 6:45am Frenchs Forest) had a great City to Surf. This is how she saw the race


I had 3 goals for the race this year..

1) run up heartbreak hill

2) run the whole 14 kms

3) run in under 90 mins

I managed all three!!! I felt good through the race (after my normal warm up 3kms and dodging the people in the early stages helped me stay …calm and not try go too fast – the hill was great – head down, feet moving, looking at the next corner and all of a sudden it was over!
The most frustrating section was the the last km – then having to dodge people did bother me – I stopped looking at my watch cause i knew I was close to getting under 90 mins and tried not to yell at people to get out of my way and, as much as possible with the crowds, I ran as fast as I could.

Smiling as I crossed the line and finally looking at my watch…. 87mins!

Happy with it all, I met some work colleagues and drank a lot of water before joining the queue for the bus home.

Thanks so much for making me a better runner


Here are all our results.

Tara McNamara: 87:47

Courtney Heyden: 73:53

Petra Thallmayer: 89:12

Jane Raftesath: 72:26

Sam Evans: 72:26

Sam O’Connor: 104:41 – fastest walker in the north

Pamela Martin: 116:44

Leanne Forster: 89:50

Susanne Lewis: 82:38 – 292nd in category

Bernice Woodbury: 82:33

Trish Pavely: 80:14

Dave Spencer: 67:59

Megan Mouradian: 71:47

Cathy Stockwell: 83:10