Each year I receive lots of text messages and emails after our runners have finished the City to Surf. And each year, these messages convey a mixture of elation and disappointment. This year of course was no different.
As coaches, we probably view your results differently to the way you view them. I thought I’d share a few of the things you should be looking at when you’re analysing this year’s results.
Your Start Group
The City to Surf is like no other race. It’s tough, it’s hilly and there are lots and lots of people. If you’re a front runner, the crowd factor isn’t going to impact you too much. If you’re running with the back of the pack, you’re unlikely to be able to get much of a rhythm going. You also have the disadvantage of coming through the water stations after 50,000 people have slurped, spilt and thrown their paper cups on the ground. You need to slow down a bit through the water stations, just for safety’s sake.
The Weather
Even though the City to Surf is a winter run, it can get pretty hot. Yesterday it was 14 degrees at 8:30am, and 16 degrees at 9:30. Last year the temperature was 9 degrees at 9am, and the top of 16 degrees wasn’t reached until 3pm that day. If you’re comparing this year’s run to last year’s, you need to take that temperature difference into account. Research done on some of the big city marathons has shown that performance decreases with a rise in temperture.
For the top three placegettes, the decrease in performance was a bit less than 1%, for every 5 degree rise in temperature above 10 degrees C. For slower runners, this drop in performance increased exponentially. Unforutnately, the reasearch only looked at the first 300 runners. The 50th placed runners’ performance dropped by 1.5%, the 100th placegetters by 1.8%, and the 300th place getters by 3.2%. 300th place would be a time of around three hours for the marathons in the sample.
If you’re comparing your time from this year’s City to Surf to last year, unless you’re a three hour marathoner, you should expect that your performance would have dropped by more than 3.2% due to the difference in temperature. To put that into perspective, a 3.2% drop in performance on a 70 minute run last year, is equal to about a 72:15 this year.
They Have Age Categories for a Reason
If you were at maximum fitness level in your prime, as you get older, your performance will naturally decline. If you weren’t at peak fitness in your younger years, you’re more likely to be able to maintain your performance simply be increasing your level of fitness.
Age graded performance tables are a great way to evaluate your performance against previous performances, and also across different events. Your age graded percentage show you how you compare to the world’s best of your age and gender. Our coach Richard Sarkies, who has a City to Surf best time of 48:12, set 12 years ago, ran 52:12 yesterday. Comparing these two runs on the age graded tables actually shows he went slightly better this year.
You can use this calculator to compare your own age-graded times.
Make sure you press “Age Grade” next to where you enter your time to get your result at the bottom.
Analysing This Year’s City to Surf Result
Once you’ve established that your time is actually pretty good compared to last year’s cooler weather time or your time of 20 years ago, you can start to learn from your results.
Firstly, you should check if your goal was realistic. When I asked Richard if he was happy with his result, he replied he “couldn’t have gone any faster”. I thought he’d been aiming for around 50 minutes, and when I asked him about that he said something like “that would’ve been nice, but what you hope to get and what you’re able to achieve are two completely different things”. After having quite a long time off rehabbing an Achilles injury, he knew he probably didn’t have the endurance to get him through to the end.
My Race Goals
Not being a massive fan of crowds, or spending hours getting home when I’m sweaty and cold, I’d never done the City to Surf before, so I didn’t really know what to expect. For various reasons, my training over the last 2 years has been intermittent at best, and I knew I didnt’ have the sort of base that’s required to do the race any justice. On top of that, I developed a nasty sinus infection about three weeks out and was laid out, unable to train. So I had a few things to take into account when setting my goals for the race.
My goals were:
- To run on feel rather than use any kind of GPS device. (I did use my stop watch to roughly keep track of how I was going at each km marker).
- Run conservatively for the first half of the race, and run the second half of the race after heart break hill faster than the first half
- Be prepared to walk some of the race if I felt I needed to
- As far as time went, I really thought I’d be lucky to run under 90 minutes (my pre-sinusitis goal had been under 80-mostly likely too ambitous)
Goal number one was pretty easy, as I don’t have a GPS device at the moment
Goal number three – I was definitely prepared to walk –in fact I did walk through a couple of the drinks stations to make sure I rehyderated (confession – I had a couple of champagnes the night before-why not since I was treating it as a training run, right?)
Goal number three-the numbers aren’t pretty, but my results do show I ran a fairly even race.

Looking at the split rank (S/Rank) and the race rank (R/Rank) you can see that I moved through the field as the race progressed. Not so rapidly in the second half of the race.
You can also see I ran 36 seconds faster over the back half of the course. I’m not entirely convinced the course measurements are accurate, but they wouldn’t be too far out.
Look at How You Handled Heart Break Hill
Everyone slows down up heart break hill. It’s a reasonably steep, long, relentless 1.4km in the middle of the race, so you should expect to slow down a bit. But how do you assess whether you slowed more than you should?
Looking at my figures, you can see that I pick up nearly 2000 places going up the hill. This means that I ran faster up heart break hill than 7% of the people who were running faster than I was before heart break hill.
These figures alone don’t tell you much, other than I was slower up the hill than 21,082 people. But, using those figures, along with how I felt throughout the race is useful. I felt ok going up the hill. I felt that before heartbreak hill I was running at a pace I’d be able to maintain for 90 minutes. The fact that I slowed down up the hill definitely helped me maintain my pace in the back end of the race. I was exhausted for the last 2 km of the race due to lack of fitness, but it wasn’t running up the hills too hard that did it to me. I was conscious of my form going up the hill, shorter strides, quicker turnover to put less strain on my legs. I used the tangents to make sure I ran the shortest distance possible. All in all, I was happy with how I handled this part of the course.
Another way you can guage how you went with heart break hill is by comparing yourself to some of the front runners. The first few place getters slow down by about 8%, Richard (208th place) slowed down by 21%, and I slowed down 15%. I still think I have a lot of room for improvement on my up hill running, but comparing these figures, I think it shows I’m heading in the right direction.
What To Do With the Data
Use your City to Surf race stats to help you learn for next time. Good race or bad race, you can take note of the stats and how you were feeling on the day, and learn a lot. If you started out at 4:30 pace, and finished up at 5:30 pace, think about how you felt for your first few kms. Remember that feeling, and know that next time, that feeling is tricking you into running faster. You have to feel as if your effort is easier than that next time you race.
If you slowed down dramatically up heart break hill, was it because you’d gone too fast early in the race? Was it because you deliberately slowed down to conserve energy? Or was it because you’re not great at running up hills and you need to build some strength in your legs and work on your hill technique?
If your’e planning on improving next time you race, make some notes now on how you ran, how you felt, what you did leading into the race. What did you do well, what would you do differently next time? When you start to plan your training for your next race, you’ll know what you need to work on.
A Good Day Out
At the end of the day, whatever your result, it was a beautiful day out with nearly 70,000 other Sydney-sider, celebrating living in this awesome city of ours.
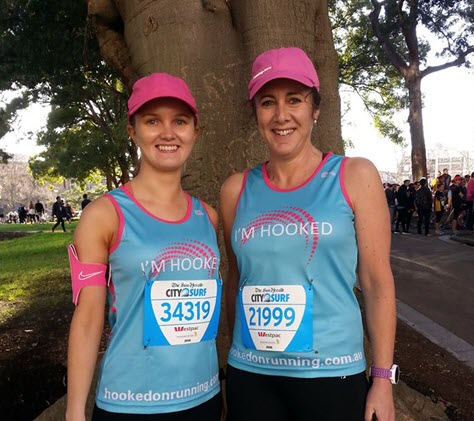
And it was a VERY good day out for Hooked on Runing teams. You can see our team results here. link to our results page






 A while ago now I wrote a post entitle